Roseman works with different software functions in the Visualization Laboratory (Vis Lab) to create images or data sets that shed light on the evolutionary process.
“Variations presented to forces of evolution may bias the ways that organisms evolve or don’t evolve,” said Roseman.
For example, a scapula and hipbone have dissimilar evolutionary origins but display shared functions in fossil records.
“We have helped develop a custom workflow for their research where they acquire macro-photographs of tiny specimens and accurately measure dimensions from the photographs. With geometric lens distortion removed and camera calibration applied, they can produce repeatable and dimensionally accurate image data.” --Travis Ross, manager of the Vis Lab
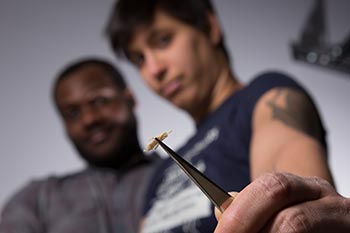
Natasha Mazumdar, one of Roseman’s research assistants, has been photographing the metapodials (hand and foot segments) of pedigreed mice to determine how these variations arise.
“The aim of this research is to examine the genetics at play in the development of these bones and test a model for this development,” said Mazumdar. “This data set will hopefully include around 800 individuals, with both forelimb and hindlimb measurements for most.”
While other fields use the word “macro” to indicate large scale, as in macroeconomics, in photography it describes close-up work.
Travis Ross, manager of the Vis Lab, has improved the accuracy of macrophotography at Beckman by creating a tiny calibration plate for the macro-lens, which generates a lens profile that is later applied to the images in Photoshop.
“We have helped develop a custom workflow for their research where they acquire macro-photographs of tiny specimens and accurately measure dimensions from the photographs.
“With geometric lens distortion removed and camera calibration applied, they can produce repeatable and dimensionally accurate image data,” said Ross.
Oshane Thomas, another one of Roseman’s research assistants, uses the Vis Lab to quantify geometric properties of bones, specifically mouse humeri. He scans the elements at high resolution in a microCT scanner with the latest protocol.
Thomas then reconstructs these scans in order to create a surface model of each bone using Amira, a software platform for 3D data visualization. He then places 3D points on the exterior of each bone so that a configuration of points can be used to describe that bone’s shape.
Amira allows a person to measure the data more precisely than traditional measurements and to discover “how differences in the shape of the humerus across all these mice relate to their genotype or to their environment,” said Thomas.
His goal is to discover how habitual movement and kinematics influence changes in bone structure throughout the lifetime of an animal, which would allow “us to more accurately reconstruct the locomotor behavior of extinct primates,” said Thomas.
Mazumdar would like to use the knowledge that she has gained from her research at Beckman in upcoming academic endeavors.
“I am interested in how genetics and environment act together to create a whole organism,” said Mazumdar. “I’d like to apply what I learn about developmental and quantitative genetics to future research about the evolution of human physical performance capacity.”
New Rates for the Vis Lab
New membership rates for Vis Lab started Jan. 1
- Vis Lab computers: $2.09/hr
- 3D scanner: $28.90/hr
- High-speed camera: $5.34/hr
- Still camera: $2.60/hr
- Training and consultation: $18/hr
- Graphics services: $50/hr
If you have any questions, please contact Vis Lab Manager Travis Ross